Analyzing Mirai-FBot infected devices found by MalwareMustDie
Written on 2020/03/04
Following a blog post from MalwareMustDie (MMD) and some tweets related to an increase in Mirai-FBot detections, we decided to demonstrate the power of our new Bulk Summary API using data published on pastebin.
UPDATE: 2020/03/05: a new list of infected devices has been put online by MMD so we have updated the JSON file from Bulk queries against 1429 unique IP addresses resulting in around 17,000 entries from our data.
Get IP list of infected hosts from MMD’s pastebin
By using standard command line tools, we can fetch the list of IPs made freely available by MMD on their pastebin:
curl -XGET 'https://pastebin.com/raw/8n9G964c' |grep -v "Infected IP of the New FBot" | dos2unix > /tmp/fbot.txt

# How many results do we have?
wc -l /tmp/fbot.txt
582
Execute Bulk Summary API request for each IP address
Now that we have a list in the correct format (1 IP address per line), we can query using the Bulk Summary API to fetch last 10 entries we have for each category of information for every IP address in this list.
The goal will be to load that data into a local Elasticsearch database and perform some analytics to learn which kind of device is actually compromised.
curl -XPOST -H 'Authorization: apikey YOUR_APIKEY' -H 'Content-Type: application/json' --data-binary @/tmp/fbot.txt 'https://www.onyphe.io/api/v2/bulk/summary/ip' > /tmp/fbot.json

# How many results do we have?
wc -l /tmp/fbot.json
8227
Loading the data into Elasticsearch
You will have to install Elasticsearch and Kibana. You can follow our training guide you can find on GitHub to easily install them. Or if you are lazy enough to not click and follow our guide, here is how to do it:
wget https://artifacts.elastic.co/downloads/elasticsearch/elasticsearch-7.6.0-linux-x86_64.tar.gz
wget https://artifacts.elastic.co/downloads/kibana/kibana-7.6.0-linux-x86_64.tar.gz
wget https://artifacts.elastic.co/downloads/logstash/logstash-7.6.0.tar.gz

tar zxvf elasticsearch-7.6.0-linux-x86_64.tar.gz
./elasticsearch-7.6.0/bin/elasticsearch

tar zxvf kibana-7.6.0-linux-x86_64.tar.gz
./kibana-7.6.0-linux-x86_64/bin/kibana

tar zxvf logstash-7.6.0.tar.gz
Once they are installed, you can load JSON data by using Logstash. Just create the configuration file named load.conf as follows:
# We use plain codec then json filter to avoid json code adding its host field
# as we are using host field in ONYPHE data.
input {
  stdin {
    codec => plain { charset => "UTF-8" }
  }
}

filter {
  json {
    source => "message"
  }
  mutate {
    remove_field => [ "message" ]
  }
}

output {
  elasticsearch {
    hosts => [ "http://localhost:9200" ]
    index => "fbot"
  }
}
And you can load the data:
cat /tmp/fbot.json | ./logstash-7.6.0/bin/logstash -f load.confPreparing Kibana
Before you can play with the data you just loaded, you have to create the Kibana index pattern. First, launch your Web browser and connect to http://localhost:5601/ then follow these steps:
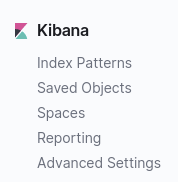
Click on “settings” application at the bottom of left menu (application menu):

Click on “Index Patterns” menu:
Click on “Create index pattern”:

Enter “fbot” as the pattern name and click “Next step”:
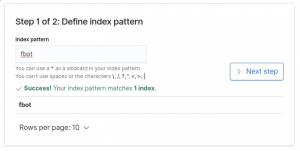
Select “@timestamp” as the timestamp field and click on “Create index pattern”. You’re set.
Ready to analyze
One of the first question one may ask is: which kind of device is compromised? We have all heard about Internet of Things (IoT), but is it the case for this botnet?
Let’s first search with the device.class filter in datascan category of information. We will create a wonderful Pie Chart visualization with the top 10 device.class. To make it better for our demonstration, we will put appart the generic devices (like Web Server, Telnet Server and all other kind of servers).
To do so, create a Pie Chart like this:
Click on “Visualize” application in the application menu:

Then click on “Create new visualization”:
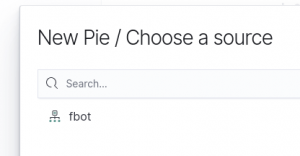
Chose “fbot” index as the source. Select the last 30 days timerange, as our Bulk export covers that timerange (actually, range is between 2nd of february and 2nd of march). And write the following filter:
@category:datascan AND NOT device.class:*Server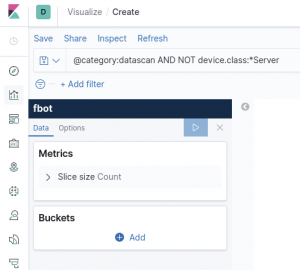
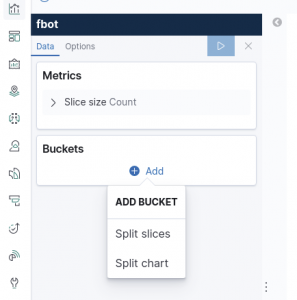
Now, we want the top 10 device classes. So click “Add” to create buckets based on different values of device.class field:
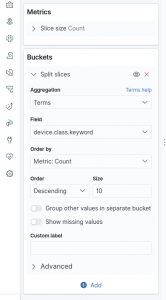
Chose the “Terms” aggregation and the device.class.keyword field. Also set to 5 the size of your top visualization:
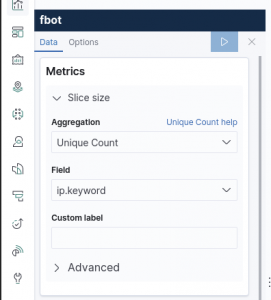
To refine things, also chose to display “Unique Count” of ip.keyword field:
Click the “Play” button, and you should have the wonderful following Pie Chart:
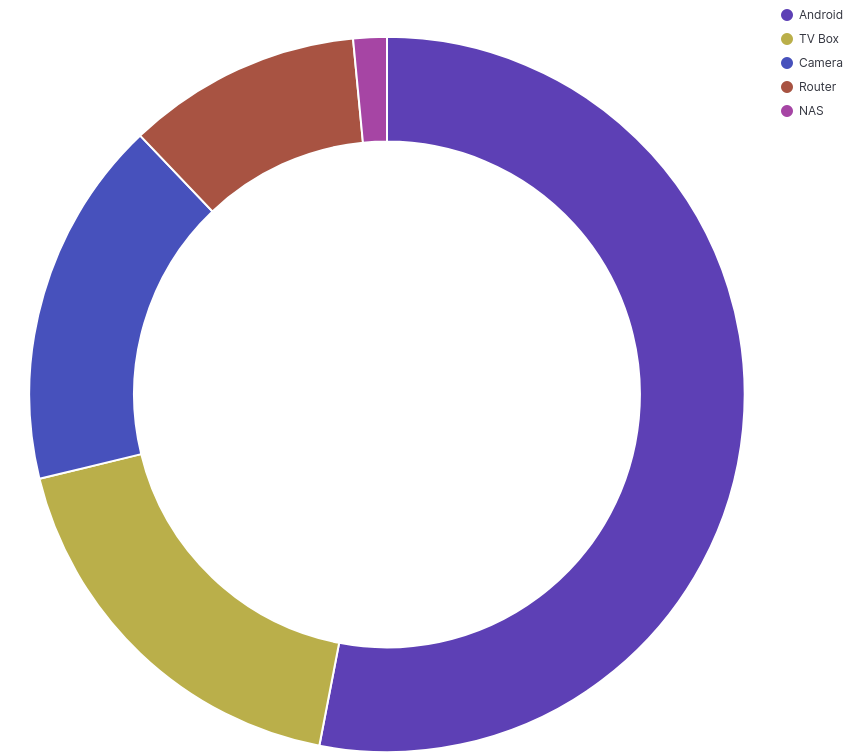
And the top 5 infected IoT devices are:
- Android (~ 53%)
- TV Box (~ 18%)
- Camera (~17%)
- Router (~11%)
- NAS (~1%)
Conclusion
As you have seen, it is easy to analyze data using Elasticsearch+Kibana and our brand new Bulk Summary API. Of course, we have other wonderful APIs as documented on our Web site.
Another question could be: how those devices were infected? And we are sur you have many other questions. Furthermore, as you have seen, we just analyzed the value of one field within the datascan category of information, we have many other categories of information, like sniffer or threatlist.
As we love our community, we decided to release for free the data we spoke about in this blog post. Download it, play with it, and let us know about your findings 🙂