Integrating The Hive and Cortex with ONYPHE - new analyzers
Introduction
Written on 2024/02/09
TheHive Project has been making life easier for security analysts in SOC, CSIRT and CERT teams since around 2017. It is a Security Incident Response Platform (SIRP) which cleverly integrates with other popular security tools such as MISP, VirusTotal and many others. There’s been an integration between TheHive and ONYPHE since the very early days in 2017, with several updates between then and 2020. However, as we’ve added new APIs and data categories to ONYPHE since then we decided it was high-time to contribute our own update to the analyzer.
Teams using both ONYPHE and TheHive can now benefit from the following features :
- A general purpose ONYPHE Search API analyzer to pull all data on an ip, domain, fqdn or TLS certificate fingerprint (hash).
- A dedicated Vulnscan analyzer, optimised for fetching critical CVE data using an ip, domain, fqdn or hash.
- An ASM analyzer, which will display baseline risks and summary information about that risk, again for an ip, domain, fqdn or hash.
- Observable extraction, including an option for auto import into the case
- The historical ONYPHE analyzer, fetching a summary of threat, ctl, geoloc and datascan data for a given IP, domain or fqdn.
Let’s take a look at those different analyzers and use cases :
ONYPHE_Search_1_0
The ONYPHE Search API is the primary way that ONYPHE users get data out of the platform, either using the web interface or the ONYPHE CLI tool. You specify a category and filter and usually within about half a second you get the data that matches.
The ONYPHE_Search analyzer will fetch the first 100 results from your chosen category, that matches the observerable within TheHive. In the default configuration, it executes the following OQL queries (ONYPHE Query Language) for the observables www.example.com, example.com and 1.1.1.1.
~$ onyphe -search 'category:datascan hostname:www.example.com -since:1M'

~$ onyphe -search 'category:datascan domain:example.com -since:1M'

~$ onyphe -search 'category:datascan ip:1.1.1.1 -since:1M'
The selected category and the time filter are configured in the Cortex Analyzer settings. 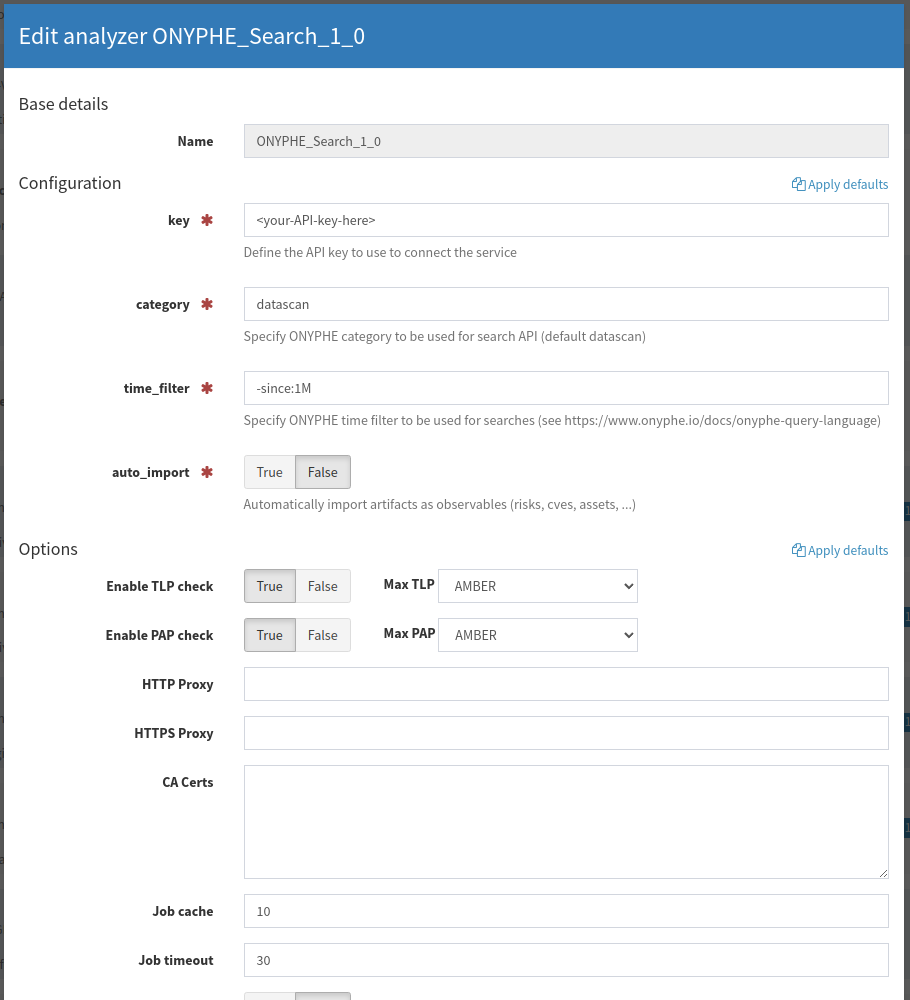
The analyzer does some work to adapt the results according to the chosen category. If you query datascan or onionscan, then the short summary report will show the number of open ports/services identified. If you query Vulnscan it will return the number of CVEs and if you query Riskscan if will show the number of risks (deduplicated for ip:ports).
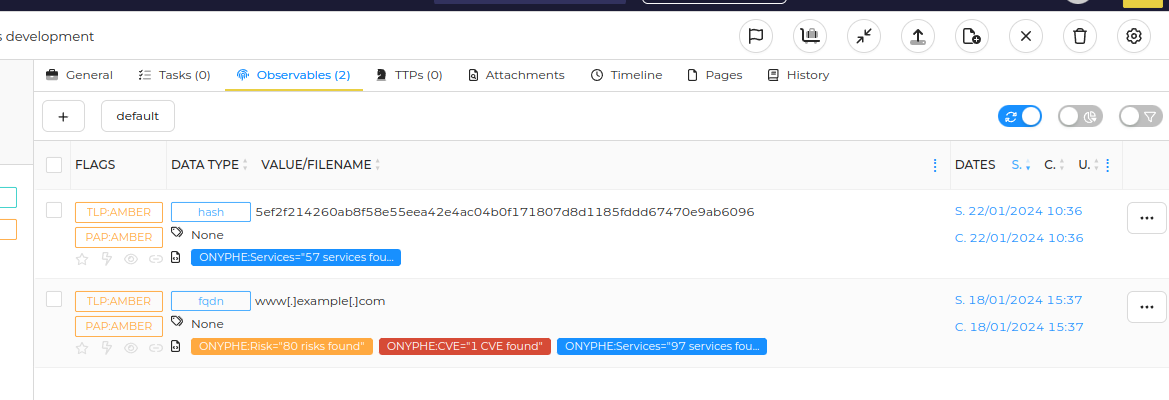
Clicking on the short report or on the Analyzer results link will take you to the full ONYPHE_Search report. Although the IPs are obscured in our screenshot, what you get is essentially the same as on the ONYPHE web interface.
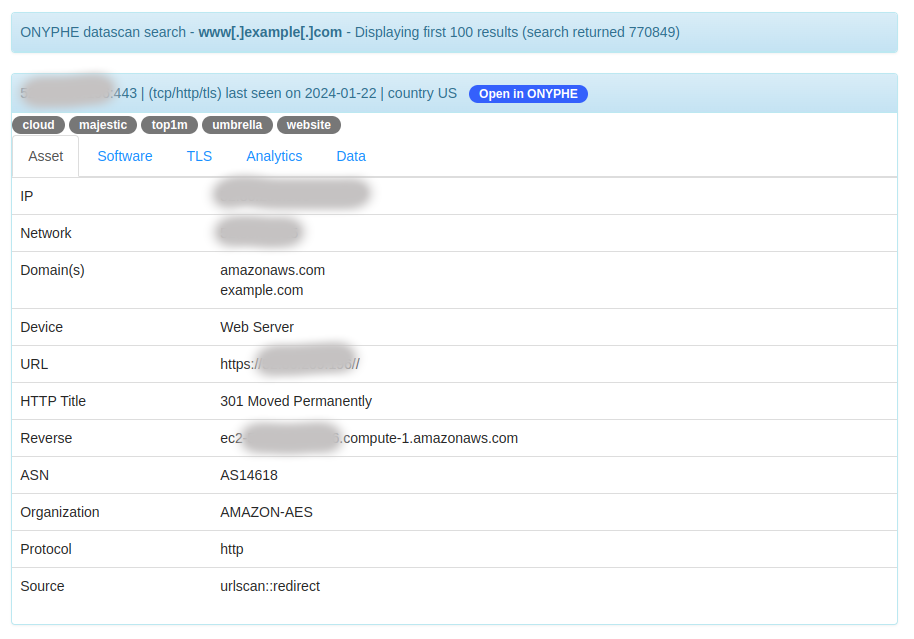
The report header displays the category used for the query, the observable, and the number of results returned by the query.
For each result, the analyzer displays :
- a title line with IP, port, transport, protocol, tls if present, the date, and the hosting country,
- the Open in ONYPHE badge, which will take you to the same results in ONYPHE,
- asset tags displayed below the title,
- a varying number of tabs depending on the raw data,
- Asset : an overview of the key data, including CVE, Risk or Threat data if relevant,
- Software : CPEs, device info or web component info,
- TLS : data from the TLS certificate if present,
- Analytics : hash info for the content and the TLS certificate,
- Summary : a summary of ‘leaked’ data, notably for open databases or open directories,
- Data : the first 16K of the full text response of the service.
The general layout should be famliar to ONYPHE users.
ONYPHE_Vulnscan_1_0
Based on the Search analyzer, the Vulnscan analyzer allows ONYPHE users benefiting from Eagle View or Griffin View licences to fetch critical CVE data for the observable you’re analyzing. This would also be possible by configuring the Search analyzer with the vulnscan category however one extra configuration option is provided on this analyzer.
In it’s default configuration, Vulnscan will return both positive and negative results for vulnerability checks. This allows users to verify that the relevant assets have indeed be scanned. Setting only_vulnerable to True will tell the analyez to only return positive CVE results.

Combined with the auto_import option, this allows you to query ONYPHE for a domain, and observables will automatically be created for IPs with known exploited CVEs, with tags added for the CVE reference and technology.
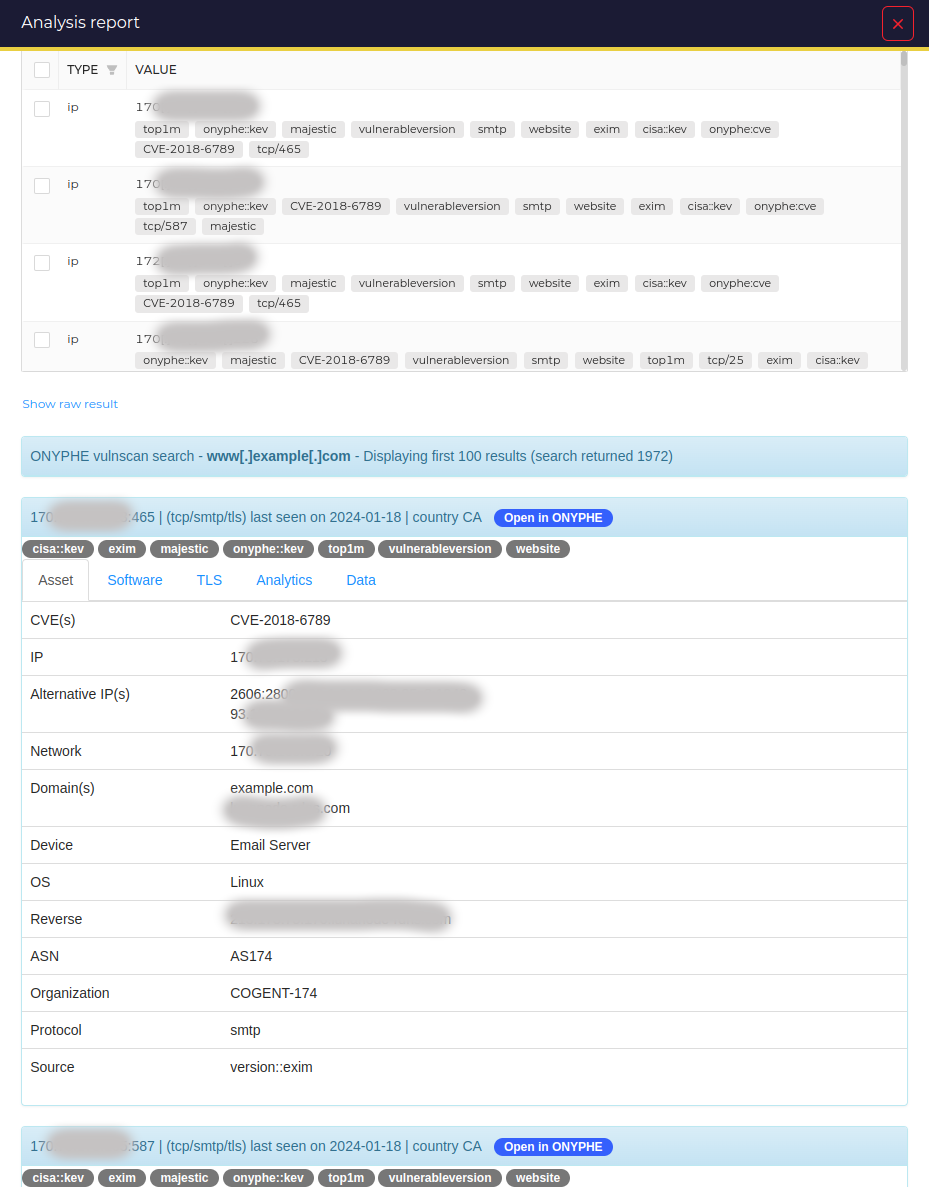
The full results of each asset are displayed in the same tabbed format as for the Search analyzer.
ONYPHE_ASM_1_0
Within CSIRT and SOC teams, it is now common to use SIRP platforms like TheHive to manage not only incidents and investigations, but also proactive preventative actions, for example as part of an Attack Surface Management process.
In this use-case, observables are not threats but rather the organisation’s assets that need defending. The ONYPHE_ASM analyzer has been designed for this use case.
It uses the Riskscan category available to ONYPHE Griffin View subscribers.
The short report currently shows the sum of the number of risks of all types, on a deduplicated list of ips and ports. (We want to improve this in a future version!)
The key difference for the ASM analyzer is in the way the full long report renders the json data.
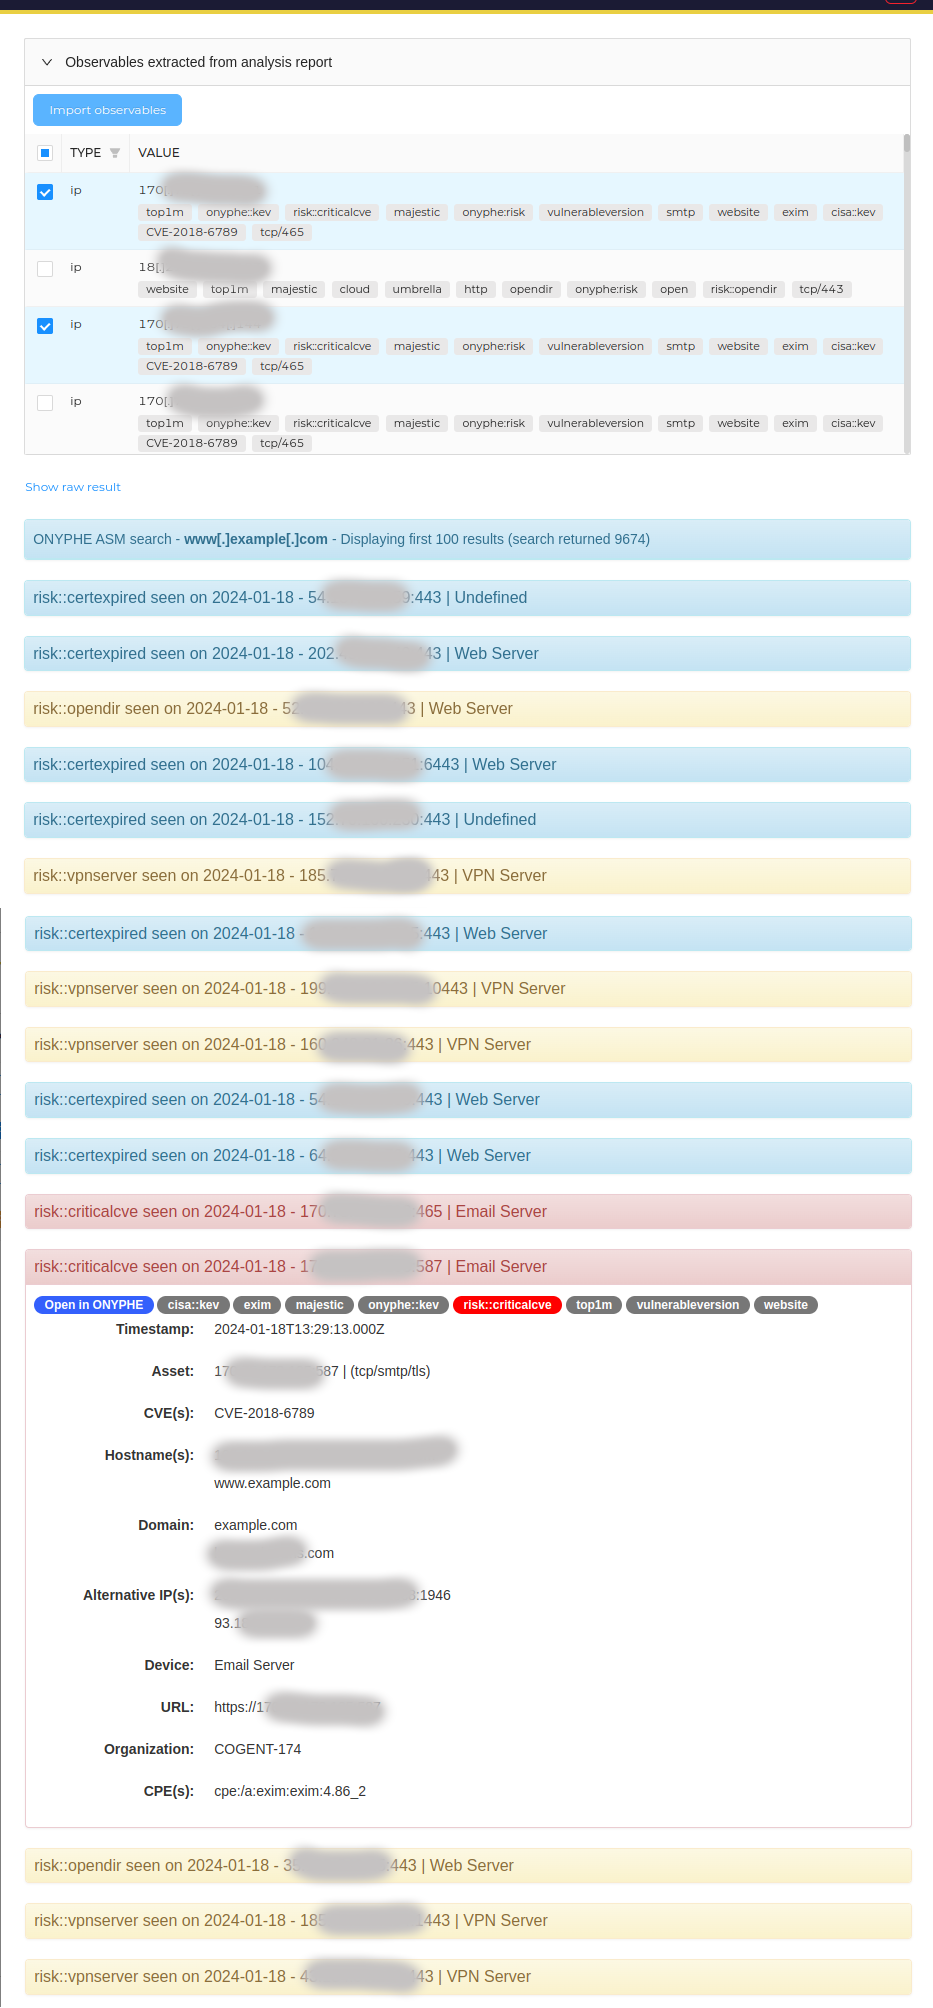
Under the general title, instead of showing results asset by asset, a chronological list of risks is displayed, with the most recent first.
Clicking on the risk title will open-up a summary of the key details required to understand the risk. As a typical large organisation would want to query the ASM analyzer for hundreds if not thousands of assets, an optimization is provided in the analyzer configuration.
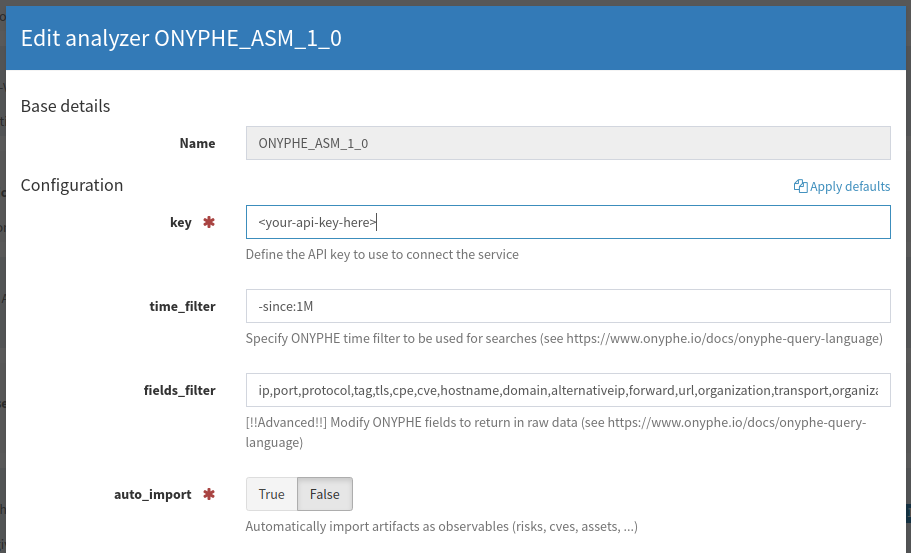
With this analyzer only the essential fields are returned in the query, speeding up the analyzer execution and saving valuable space in your TheHive database. If you need an additional field in the raw data report you can modify the list of fields in the analyezr settings (but modify with care :).
Observable Extraction
For all of the new analyzers, the full report contains extracted observables which can be imported back into the case, manually or automatically.
One issue which arose when working through these use cases is that it is not possible to import a duplicate observable into a case. Therefore if the data used to run the analyzer is an IP, it’s currently not possible to import that IP back into the case, even if new enriched tags have been identified. The analyzers therefore take an opinionated decision and return different kinds of extracted observables depending on the initial data used.
| Initial observable | Extracted observables |
| ip | fqdn |
| domain | ip |
| fqdn | ip |
Each extracted observable is tagged with relevant information depending on the source category. For datascan there are tags with the protocol, transport/port and the onyphe:asset tag.
For vulnscan the observables have CVE tags and the onyphe:cve tag.
For riskscan or ONYPHE_ASM the extracted observables are tagged with risks and the onyphe:risk tag.
Summary analyzer
The Onyphe_Summary analyzer has been left virtually unchanged. There was one tiny bug which needed fixing to allow for searches using fqdn observables. We have left the Onyphe_Summary name in Title case for backward compatibility in the Cortex configuration file. All other analyzers start with ONYPHE in uppercase.
Future improvements
These analyzers are just the first version. We have lots of ideas in the pipeline but we wanted to put this initial version in the hands of our users. Here are some of the ideas we’d like to implement in the future:
- A Passive DNS analyzer using the resolver category,
- A Threatlist analyzer,
- Better extracted observable handling, notably for multiple CVEs on the same IP/fqdn,
- Improved ASM short report, to show three levels of risk (info, warning, danger),
- Filter for common tags,
- Configuration options for which ASM risks are displayed, at at which level,
We hope you enjoy these new analyzers which should be landing in the Cortex-Analyzers repo about the time you read this. Additional screenshots and documentation are available here in the analyzers section.
Thanks to the StrangeBee team for their support with getting these analyzers built and tested.